IHSA enrollment numbers observations

When I published Northern Illinois Sports Beat from 2004 to 2013, I took an interest in numbers and applied them to trends to find out which schools were growing and shrinking, especially with the four-class system in team sports.
The release of the coming year’s enrollments and classifications were as Christmas-like as football pairings night. Which schools moved in classification? What 3A schools went down to 2A? How much are those schools between I-39 and Chicagoland growing? What growth trends will cause the next rift in conference changing? This is why I did this.
One year, not too long after the start of the four-class system, I ran a comparison of enrollments. I did this each year for the remaining years I ran NISB, and continued doing it for a couple of years after I joined Sauk Valley Media. However, this dedicated task went less dedicated one year as I quit comparing figures for non-SVM area schools, and only did this with the handful of schools that I worked the most with.
Below is a chart from 2017-18 comparing enrollments of schools from the Sauk Valley:
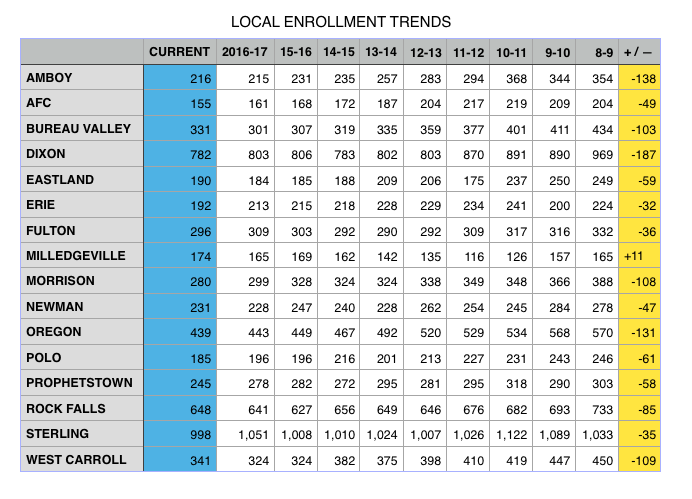
Note that in my Milledgeville row, my plus-minus math is accidentally off by two students (should be +9). MHS was the only school in the area to see an increase in enrollment from 2008 to 2017.
I shifted over to general news coverage not too long after making that list, and prep sports hasn’t been my primary concentration since the start of the pandemic.
However, with everyday issues such as inflation and attitude toward the Pritzker Administration in Illinois in recent years, it made me revisit the IHSA list of enrollment figures.
The way the enrollments and classifications work now is that a two-year period of classification structure depends on the average of the enrollments over the previous 2 years (figures released in ISBE’s Fall Housing Report each Sept. 30). Averages will lead to decimal figures in enrollment ranking to break whole number ties for classification cutoffs. One main reason for the change is to help schools figure out where they will play in the future a little clearer.
Using the chart above, and what I can remember from my old NISB lists, I have taken a peek at the enrollment figures the IHSA will use for 2023-24 and 2024-25 and compared them. Note that most enrollments of downstate schools have dropped in recent years, leading to the real figures being “less than” the actual number presented.
| School & school year | 2008-09 | 2017-18 | 2021-22/2023-24 avg. | +/- bet. 2008 & 2022 (in whole, est.) |
| Amboy | 354 | 216 | 177.64 | – 177 — 50% |
| Ashton-Franklin Center | 204 | 155 | 136.78 | – 68 — 33.3% |
| Bureau Valley | 434 | 331 | 310.88 | – 124 — 28.6% |
| Dixon | 969 | 782 | 733.15 | – 236 — 24.4% |
| Eastland | 249 | 190 | 182.36 | – 67 — 26.9% |
| Erie | 224 | 192 | 183.55 | – 41 — 18.3% |
| Fulton | 332 | 296 | 270.75 | – 62 — 18.7% |
| Milledgeville | 165 | 174 | 113.69 | – 52 — 31.5% |
| Morrison | 388 | 280 | 267.75 | – 121 — 31.2% |
| Newman | 278 | 231 | 210.00 | – 68 — 24.5% |
| Oregon | 570 | 439 | 436.22 | – 134 — 23.5% |
| Polo | 246 | 185 | 166.25 | – 80 — 32.5% |
| Prophetstown | 303 | 278 | 188.17 | – 115 — 38% |
| Rock Falls | 733 | 641 | 547.57 | – 186 — 25.4% |
| Sterling | 1,033 | 998 | 973.50 | – 70 — 6.8% |
| West Carroll | 450 | 341 | 256.57 | – 194 — 43.1% |
Observations:
The Amboy figure is staggering at just more than 50% enrollment loss in 15 years. Lee County itself has taken a hit with almost 25% lost at Dixon and more than 30% lost at AFC, along with the closure of Paw Paw.
Rock Falls has a roughly 20-22% population decline since the 1980 census, when it had just over 10,000 residents, which is significant for a mid-sized down in Illinois. The Rockets used to always been around the small/large school cutoff, but that’s not the case now.
Sterling is weathering the downward trend other schools are feeling, despite its enrollment being in the high 900s for the first time since the early 1950s.
P-Town’s 38% drop parallels that of its increase in low-income students from Prophetstown, Lyndon, Tampico and Deer Grove.
West Carroll’s enrollment decline is at about 50% from its formation in 2004 after the consolidation of Savanna, Mt. Carroll and Thomson. Today, 250 students come from those three communities; there were about 250 students in Savanna alone just before consolidation.
A glance at the new enrollment figures for other schools has me coming up with these additional observations over a 15-20 year period:
Ohio is down to 15 or so high school kids. Ouch!
Leland’s enrollment has been cut in half since before it began co-oping with Earlville in all sports (that co-op has since dissolved).
Scales Mound has held steady at around 75 kids since its Cinderella volleyball season in 2010.
I have never seen SO MANY two-digit schools. New ones that come to mind are Goreville, Cairo (no surprise there), Alden-Hebron, Annawan, Rockford Christian Life, Orangeville, and Warren (at minimum).
Going through the numerical list, I’m looking at certain schools and thinking, “down,” “down,” “down,” “down,” “down,” “down,” “down,” “down,” “down” …
Durand at around 173 seems like it’s down by about 40-43%.
Galena’s 233 isn’t down by a whole lot since its a football title win in 2003, about 30 students. That’s less than Lena-Winslow’s enrollment decline since its first of five state titles in 2010, down by about 70 students to 240.
Lisle and Westmont, two small suburban schools landlocked between much larger communities, both have less than 400 students.
Byron is now larger than Oregon (incl. Mt. Morris) by about a few students.
Genoa-Kingston was primed for some good growth, but its enrollment has fallen by about 125 since the housing bubble burst.
Mendota and Princeton both close to falling below 500 students.
Sandwich! At about 800 students 15 years ago, now hovering just above 500. It, too, was primed for growth just before the housing bubble. Plano, on the other hand, has actually grown … it’s now up to more than 732 students.
Richmond-Burton, Marengo and Johnsburg also have seen hits despite being on the western fringe of Chicagoland. Harvard, however, is up by about 150-175 kids in the past 15 years.
Kewanee has actually GROWN? More than 567 students are enrolled, when around 520 were about 15 years ago. It has essentially picked up Wethersfield’s losses from around that same time.
Freeport’s enrollment has dipped below 1,000 for the first time in maybe 75 years.
Peoria-area schools Dunlap (1,337) and Washington (1,426) have really grown lately.
Private schools, ouch! Rockford Lutheran (282), Woodstock Marian (389), Montini (488), Joliet Catholic (585), Boylan (673).
Yorkville is fast approaching 2,000 students.
Huntley is the school most often talked about in regard to suburban growth. In 1995, its enrollment was 435 students. In 2022, it has now surpassed 3,000 students!
